
🔍 Overview
AI and ethics is popular now! Thank you The Social Dilemma.
One line that stuck with me from the film was along the lines of "people are focused on when AI surpasses human strengths, not when it surpasses human weakness, which it already has". I think this is very powerful, as you just need to do is look around, carefully, to observe the flawed effects that software has had on us.
This course provides an overview of ethical AI, the different categories, and bias mitigation techniques. There is a large focus on writing and class discussions. How do we design algorithms that process the vast and potentially biased training data, while ensuring their outcomes aren't misused?
*I took this course Fall 2020, contents may have changed since then
🏢 Structure
- Assignments - 25% (of the final grade)
- Projects - 55%
- Exams - 20%
Modules
There were weekly assignments that varied in scope and difficulty. This includes basic data analysis, written critiques, and class forum discussion. I will not list every single one here, but try to group them together into something digestible. Overviews of assignments under these modules will be discussed in further detail.
- Data, Individuals, and Society - Ethical issues for big data, fairness and bias in algorithms
- Big Data & Statistics - Descriptive statistics, inference, and misleading results
- AI / ML Techniques - Overview of predictive algorithm techniques, existing bias, and the implication of these methods
- Bias Mitigation Applications - Solutions to mitigate bias in algorithms and their trade-offs
Projects
Projects are assigned throughout the semester, and each included some technical analysis as well as a report to summarize findings.
- Facebook - Downloading your Facebook data and summarizing the information they have of you, as well as pinpointing inaccuracies
- Stats 101 - Basic statistical analysis and familiarity with Python
- AI / ML - Exploratory data analysis over a dataset on credit defaults and bias mitigation techniques
- Final Project - Open-ended group project which explored a dataset of choice, existing biases, and applying bias mitigation techniques.
Exams
The first exam was multiple choice and short answer to be taken on Canvas. The second exam (the final) was a written analysis of a recent article that discusses AI ethics. These both covered the same topics as assignments and projects, so I won't go into further detail.
📁 Module 1 - Data, Individuals, and Society
AI/ML algorithms are being deployed by organizations to make decisions that impact us in direct ways, such as:
- Filtering applicants for jobs, admissions, etc
- Approving applicants for loans, banks, and credit cards
- Predicting risk levels for insurance and health benefits
- User profiling for policing purposes and prediction of criminal recidivism (how likely are they to reoffend?)
- Identifying risk of developing mental health problems
These are high-impact decisions that contribute towards an individual and community's wellbeing. To achieve a fair and unbiased model is difficult, because humans are biased, and machine learning models are trained on this biased input. Garbage in garbage out.
Discrimination law protects protected classes against unfair treatment and decisions. Here is a list of those classes. Much of the focus in this course is discussing the impact on protected classes that certain decisions or scenarios may have.
💻 Project 1 - Facebook
We examine our own social media data to begin to look at how large organizations interpret and use our personal data. Every user on Facebook can download their data, which includes all messages, assets, and advertising info.
We can categorize the advertising data. The following graphic shows the segments that Professor Howard posted

There are additional tasks, such as identifying which advertisers fall under regulated domains.
📁 Module 2 - Big Data & Statistics
Statistical analysis is used to manipulate, summarize, and investigate data so that useful decision-making information results. Unfortunately "useful decision-making" is a subjective concept and often results in reaching for a conclusion you already wanted.
BS of Statistics, as this course frames it, involves misleading or misunderstanding data through various means.
You can mislead through poor sampling, by, for example, performing an experiment on high school from one school and generalizing it to the behavior of all high school students.
Poor analysis can involve purposeful, or accidental, modeling and transformation of data to be unrepresentative of the true scenario.
Finally, poor interpretation, can be achieved by displaying data in a misleading way. Us humans are simple creatures, and our System 1 can make quick conclusions.

The latter portion of this module provides an introduction to numpy, pandas, and Jupyter notebooks. Kaggle definitely has good introductions to these frameworks.
💻 Project 2 - Stats 101
We apply some of the statistics concepts from Module 2 for this assignment.
This involves proper interpretation of variables and categorization of protected classes and regulated domains.

This includes basic exploratory data analysis by observing outcomes based on a variable, like protected class.

Overall, the task is to follow the instructions, which are relatively clear, to provide further statistical measures.
📁 Module 3 - AI / ML Techniques
The goal of this module is to understand and apply basic AI/ML techniques to data scenarios, with a focus on instituting “fair” practices when designing decision-making systems based on big data. What makes this particularly challenging beyond the technical aspects is that fairness is a vague term that will have different meanings from person to person.
Word2vec is a word embedding technique used to identify similarities between words. It is often trained on books, speeches, and other human-created texts. It is often biased and presents stereotypes when it is used to predict the next word. The following are examples from lecture of using this model while allowing it to fill in the pronoun.
she is a cook
he is an engineer
he is a doctor
she is a nurse
he is a cleaner
He-she is a police
he is a soldier
She's a techer
he is a secretary
she is married
he is single
This happens because the co-occurrences of words that humans use are representative of our biases.
ML algorithms can be used for crime prevention, such as predicting areas where a crime is likely to occur based on past behavior.

COMPAS is a proprietary model which provides a "risk of recidivism" score. A court ruled that these scores can be used by judges. They must receive the disclaimers and criticisms, but they can still use them as a factor to impose terms and conditions on parole, as well as provide non-prison alternatives.
While all of these applications can have beneficial use cases, if left unchecked they will result in a disproportionate feedback loop against unprivileged groups.
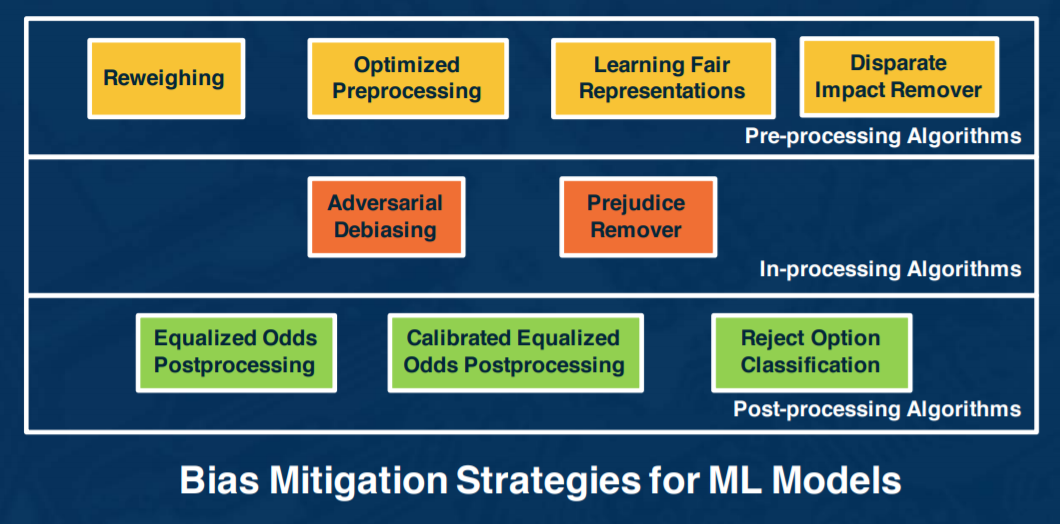
📁 Module 4 - Bias Mitigation Applications
We look at tools and methods to quantify bias and examine ways to use algorithmic fairness to mitigate this bias.
IBM has an open source tool, AI Fairness 360 (AIF360), which does a great job of implementing some bias mitigation techniques, as well as demoing it. We used it extensively during the latter half of the course.
Exploring algorithmic fairness begins with proper measurements, such as the following metrics:
- Statistical Parity Difference - Difference of the rate of favorable outcomes received by the unprivileged group to the privileged group
- Equal Opportunity Difference - Difference of true positive rates between the unprivileged and the privileged groups
- Average Odds Difference - Average difference of false positive rate and true positive rate between unprivileged and privileged groups
- Disparate Impact - Ratio of rate of favorable outcome for the unprivileged group to that of the privileged group
Unprivileged vs privileged is a determination you make, which can often be discovered from exploratory data analysis.
Let's use the AIF360 tool to go through an example. In this demo, we use a recidivism dataset, and compute the bias metrics. We then apply a pre-processing strategy, reweighing, to ensure fairness before classification. Here are the results:

In this case, the privileged group is female for crime. Consider what scenarios and datasets the privileged sex might be reversed. Also, the prediction after mitigation remained unchanged, which is desirable. Oftentimes, the absolute accuracy may drop after bias mitigation techniques.
We can't apply strategies blindly and only optimize for certain metrics, but the use case and after-effect must be considered in fairness-aware algorithms.
- If your model is sending people to jail, it may be better to have more false positives than false negatives
- If your model is handing out loans, it may be better to have false negatives than false positives

💻 Project 3 - AI / ML
Now, we apply the discussed analytics and AI/ML techniques to transform a current biased data-set into a more objective solution.
I'm actually going to touch on the three assignments here, all of which were somewhat related to this topic.
The dataset we used was a default on credit card clients dataset from Taiwan, which included payment information and demographics, in addition to default results.
We can group outcomes to protected classes, and generate bias metrics accordingly. After some more data exploration, we need to do some basic feature engineering to prepare the dataset for classification. The focus wasn't on achieving impressive classification, but rather the analysis on the effects of certain results.
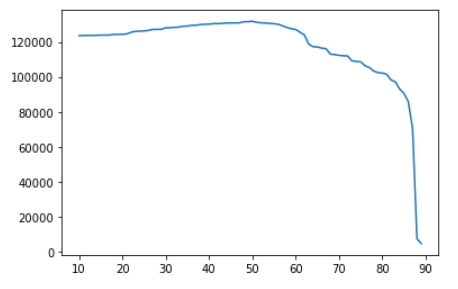
An interesting question was to determine what approval would be most profitable for the business. Based on the outcome probability our classifier provides, we can determine at what point we declare an individual too risky and not grant the loan. Here is the graph of thresholds vs projected profit.

x-axis: threshold. y-axis: predicted profit
In this case, our classifier is predicting whether they will default (bad!) or not, so when the threshold is higher, then we predict they do default and do not grant a loan. Not granting loans (higher thresholds) will yield less profit. Granting too many loans (lower thresholds) yields more defaults, which also reduces the profit.
And at the max profit, we can see with the disparate impact that there is heavy bias against the unprivileged class
💻 Final Project
The scope of questions and requirements for the final project was similar to this project. We had to find our own dataset of a regulated domain which had variables in at least two protected classes, and two unfavorable types of outcomes for prediction.
In this case, I chose a recidivism dataset with my two protected classes as race and age, and outcome variables as recidivism (again, whether they reoffend or not), and whether their crime was violent or not.

⏩ Next Steps
I highly recommend the course book, Weapons of Math Destruction, as well as The Ethical Algorithm.
This field is still developing, and there is work to be done in this field in terms of social change, technical improvement, and business implementation. The course provides the introduction to take the next step in any of those categories.


